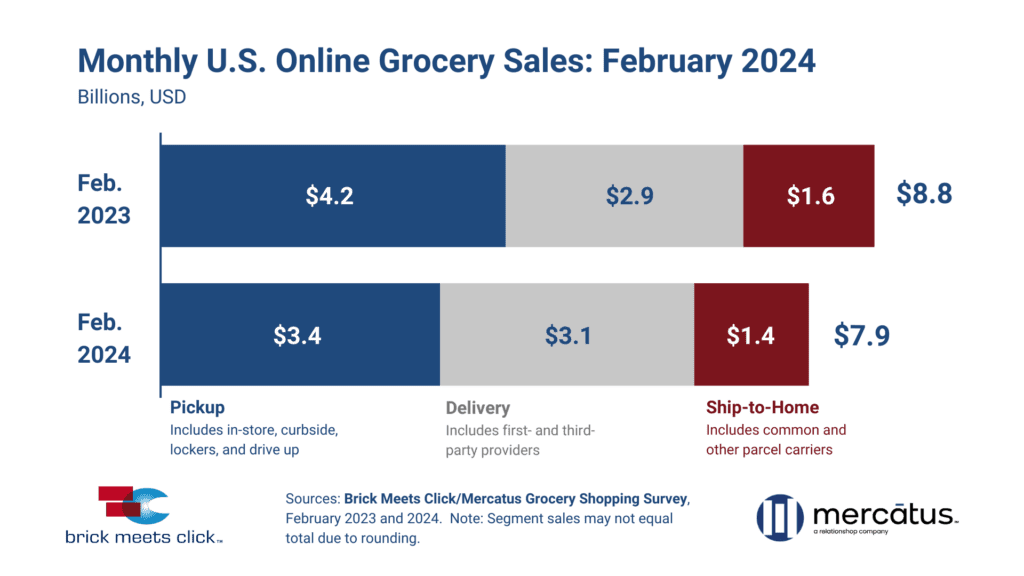
U.S. online grocery sales fell 10.5% year over year in February 2024, according to data from the monthly Brick Meets Click and Mercatus Grocery Shopping Survey. The results framed shifting behaviors for U.S. consumers.
February online grocery sales totaled $7.9 billion in the U.S. That comes after January online grocery sales grew slightly. December 2023 sales decreased slightly.
Brick Meets Click and Mercatus conducted the survey at the end of February 2024 with 1,755 respondents who shop for groceries online. Results compare with those from a February 2023 survey of 1,745 online grocery shoppers.

February online grocery sales in the US
Brick Meets Click and Mercatus define the three receiving methods for online grocery sales as:
- Delivery: Includes orders received from a first- or third-party provider like Instacart, Shipt or the retailer’s own employees.
- Pickup: Includes orders received by customers either inside or outside a store or at a designated location/locker.
- Ship-to-home: Includes orders that are received via common or contract carriers like FedEx, UPS, USPS, etc.
Ship-to-home online grocery sales fell 15.4% year over year to $1.4 billion in February. Pickup sales fell 12.8% year over year to $3.4 billion. Delivery was the only sales method to grow year over year in February — up 4.7% to $3.1 billion.
Lower average order values (AOV) guided the downward online grocery sales trend in February, Brick Meets Click said. AOV fell 10% across all three receiving methods in February.
Ship-to-home sales fell 15.4%, and pickup sales fell 12.8%. Meanwhile, delivery was the only sales method to grow sales (4.7%) in February. Brick Meets Click attributed that growth to a “strong rebound in monthly active users (MAUs) versus last year.”
“Convenience remains one of the primary motivations for shopping online for groceries. However, for some customers, cost considerations are now weighing more heavily on their decision on how to shop,” said David Bishop, partner at Brick Meets Click, in a statement. “This means that the explicit costs associated with eGrocery services are more likely to impact how these customers grocery shop, whether that’s returning to in-store or shifting where they shop online.”
How does Walmart factor into US online grocery sales?
Walmart AOV dipped 2% for pickup and delivery orders, according to the data. At the same time, supermarkets reported a 15% AOV drop for pickup and delivery compared to February 2023.
Walmart is No. 2 in the Top 1000, Digital Commerce 360’s ranking of North America’s online retailers by web sales. Digital Commerce 360 categorizes Walmart as a Mass Merchant in the Top 1000 Database. Walmart is also No. 9 in the Global Online Marketplaces Database, Digital Commerce 360’s ranking of top online marketplaces.
Brick Meets Click and Mercatus data shows that in February, more than 30% of households that bought groceries online from a supermarket’s service also did so from a mass merchant’s service.
“Although regional grocers may not always be able to match the low prices offered by Mass merchants like Walmart, they can capitalize on customer insights to refine their service offerings” said Mark Fairhurst, global chief growth officer at Mercatus, in a statement. “By using data to understand customer behavior, regional grocers can personalize shopping experiences, offer targeted savings, and ultimately, provide value that goes beyond pricing. This strategic use of customer data is essential for regional grocers to differentiate their services and maintain customer loyalty in a highly competitive market.”
Do you rank in our database?
Submit your data and we’ll see where you fit in our next ranking update.
Sign up
Stay on top of the latest developments in the ecommerce industry. Sign up for a complimentary subscription to Digital Commerce 360 Retail News. Follow us on LinkedIn, Twitter and Facebook. Be the first to know when Digital Commerce 360 publishes news content.
Favorite