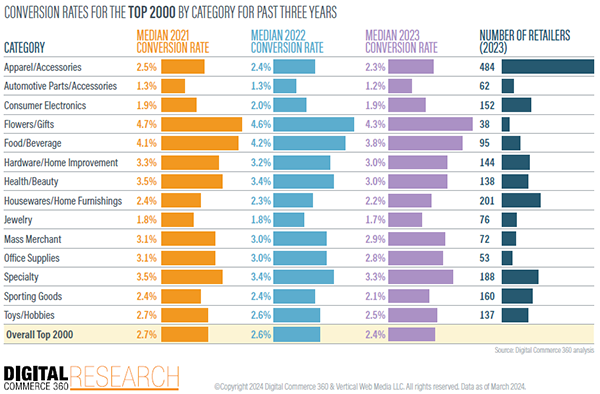
Improving conversion rates in 2024 poses one of the most important questions that a retailer can face: How do you convince a shopper to complete an order?
Just holding a potential customer’s attention in a world awash in digital channels and distractions can be a singular challenge. Nevertheless, motivating each buyer to finish the checkout process is what ultimately drives business outcomes for ecommerce sites.
New data on ecommerce conversion rates
The latest Ecommerce Conversion Report from Digital Commerce 360 breaks down which merchant types are seeing the best results in today’s digital environment. More importantly, however, the report showcases examples of the conversion strategies that shoppers seem to like, as well as the strategies that successful online retailers say are working for them.
First, take a look at how rates shifted in 2023. According to Digital Commerce 360’s analysis of results from retailers ranked in the Top 1000 database, the highest-ranked 2000 retailers in North America by web sales saw their conversion rates fall to 2.7% in 2023. That was down from 2.8% in 2022.
The year-over-year change in conversion rates varied slightly across categories. For instance, consumer brand manufacturers fell to 2.4%, the lowest among categories, from 2.5% in 2022. Direct marketers remained the most successful category at 3.7%. Yet even that was down from 3.9% in 2022 and 4.1% in 2021.

Strategies that are working
So what are online retailers doing to minimize drop-offs and sustain better conversion rates? The new report breaks down approaches and best practices among companies including Ikea, Overstock, Newegg, and more, with insights into the choices and priorities that they see translating into sales.
Readers working in online retail can expand their toolsets in areas such as:
- Building trust with shoppers
- Getting price and shipping right
- Knowing what to try on social media
- Keeping customer service in focus
- Mobile experiences
- Omnichannel options
- Personalization
The Ecommerce Conversion Report also contains takeaways from exclusive survey data that gets inside the heads of shoppers, asking them questions about which online platforms’ ads they are most likely to click and what their most common reasons are for leaving items in their shopping carts.
In addition, the report comes with actionable recommendations based on these findings. All of this is accompanied by more than 15 charts to make the data easier to digest.
It’s a deep look into one of the most vital metrics that any ecommerce site can track. Still, it’s one we know a lot about — and it’s a problem that has solutions.
Do you rank in our database?
Submit your data with this quick survey and we’ll see where you fit in our next ranking update.
Sign up
Stay on top of the latest developments in the ecommerce industry. Sign up for a complimentary subscription to Digital Commerce 360 Retail News. Follow us on LinkedIn, Twitter, Facebook and YouTube. Be the first to know when Digital Commerce 360 publishes news content.
Favorite